NRU Benzodiazepine Receptor (BZR) Atlas
Overview
Gamma-aminobutyric
acid (GABA) is the main inhibitory neurotransmitter in the human brain and
plays a key role in several brain functions and neuropsychiatric disorders such
as anxiety, epilepsy, and depression. The binding of benzodiazepines to the
benzodiazepine receptor sites (BZR) located on GABAA receptors (GABAARs)
potentiates the inhibitory effect of GABA leading to the anxiolytic,
anticonvulsant and sedative effects used for treatment of those disorders.
However, the function of GABAARs and the expression of BZR protein
is largely determined by each GABAAR subunit stoichiometry (19 genes coding for
individual subunits), and it is not well understood how these mechanisms may
vary between individuals and across different brain regions.
Here, we present a quantitative high-resolution in vivo atlas of the human brain BZRs, generated on the basis of [11C]flumazenil Positron Emission Tomography (PET). Next, based on autoradiography data, we transform the PET-generated atlas from binding values into BZR protein density. Finally, we examine the brain regional association with mRNA expression for the 19 subunits in the GABAAR, including an estimation of the minimally required expression of mRNA levels for each subunit to translate into BZR protein.
This represents the first publicly available quantitative high-resolution in vivo atlas of the spatial distribution of BZR densities in the healthy human brain. The atlas provides a unique neuroscientific tool as well as novel insights into the association between mRNA expression for individual subunits in the GABAAR and the BZR density at each location in the brain.
Data
All participants included in this study were healthy controls from the Cimbi database (Knudsen et al., 2015); the data analysis was restricted to include individuals aged between 18 and 45 years. Participants were recruited by advertisement for different research protocols approved by the Ethics Committee of Copenhagen and Frederiksberg, Denmark. A total of 26 PET scans and corresponding structural MRI were acquired for 16 individual participants; 7 subjects had only 1 scan, 8 subjects had 2 scans, and a single had 3 scans.
Methods
PET
data was acquired in list-mode on a Siemens HRRT scanner operating in
3D-acquisition mode, with an approximate in-plane resolution of 2 mm (1.4 mm in
the center of the field of view and 2.4 mm in cortex) (Olesen et al., 2009).
The radioligand was given either as a bolus or as a bolus-infusion protocol.
PET frames were reconstructed using a 3D-OSEM-PSF algorithm (Comtat et al.,
2008; Sureau et al., 2008). Scan time was 90 minutes divided into 35 frames
(6x5, 10x15, 4x30, 5x120, 5x300, 5x600 seconds). Dynamic PET frames were
realigned using AIR 5.2.5 (Woods et al., 1992). The PET data was quantified to
estimate total distribution volumes (VT) for each brain region using
steady-state analysis for the bolus-infusion protocol and Logan analysis for
the bolus protocol, corrected for radio metabolites (Feng et al. 2016).
T1-weighted structural MRI were acquired on two different 3T Siemens scanners
with standard parameters. For further details on structural MRI acquisition
parameters, see Knudsen et al. (2015).
Please see Figure 1 for a full overview of the methodology.
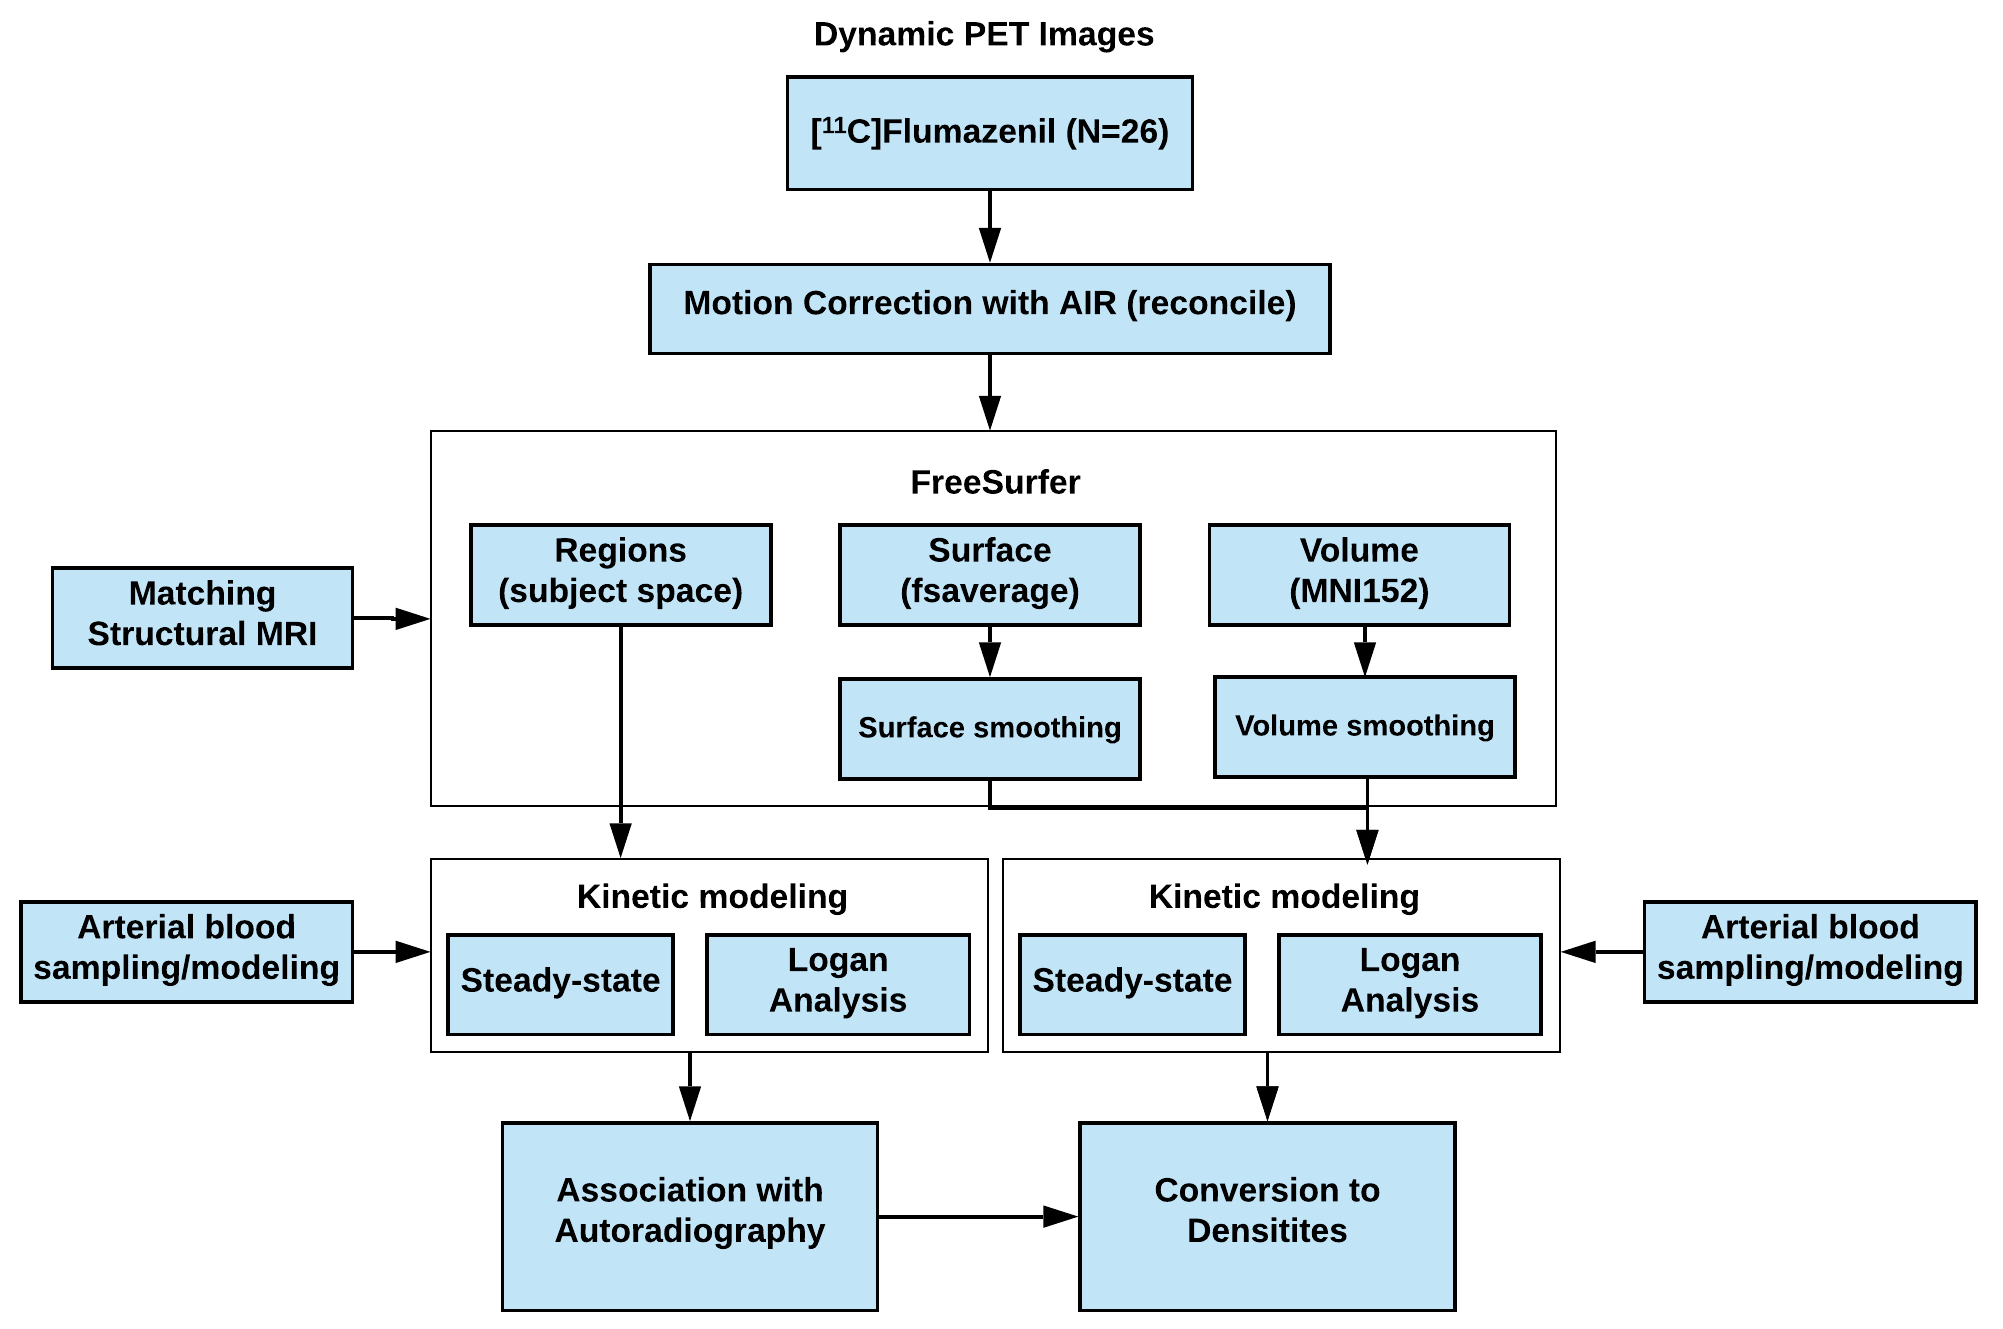
Figure 1: Flowchart of the processing of the MRI and PET data using the radioligand [11C]Flumazenil, ranging from motion correction, matching of structural MRI using FreeSurfer (v. 6.0), kinetic modeling with arterial sampling, and finally establishing the association between postmortem human brain autoradiography from Braestrup et al. 1977 and the regional total distribution volumes (VT).
Atlas maps
The BZR density (pmol per gram protein) was obtained by normalizing VT with the corresponding postmortem human brain [3H]diazepam autoradiography data from Braestrup et al. 1977. The non-displaceable distribution volume (VND) was estimated as the intercept (Figure 2B). The atlas was transformed to represent protein densities in pmol/ml (Figure 2A). Finally, the association between protein density and mRNA expression for the 19 GABAAR subunits was assessed using the Allen Human Brain atlas (Hawrylycz et al. 2012). The association between the BZR density and the three commonly expressed subunits (a1, b2, and g2) can be found in Figure 3. The association between the BZR density and all the 19 subunits can be found in Figure 4.
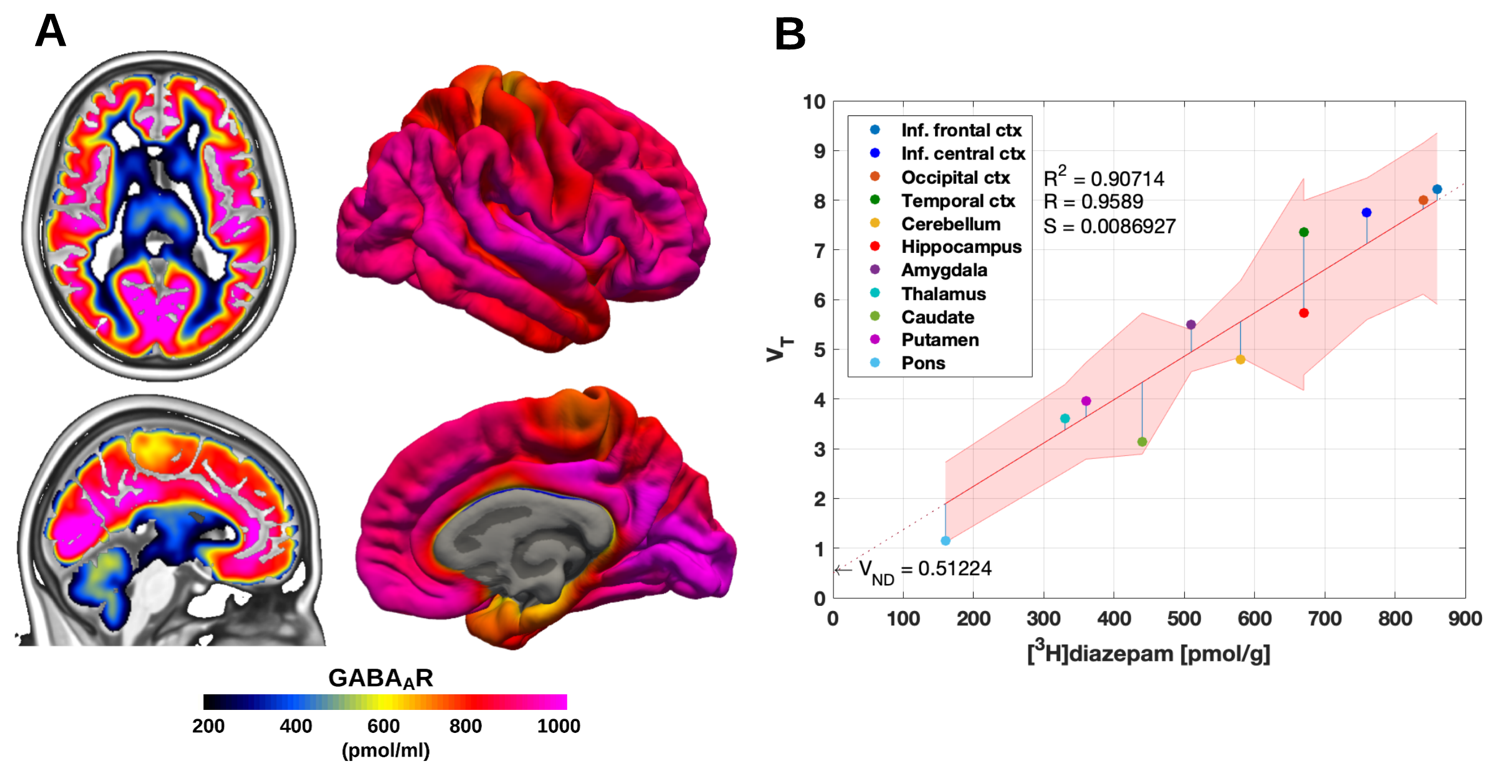
Figure
2: (A) High
resolution atlas of GABAAR density (pmol/ml) in MNI152 space (left)
and in fsaverage space (right) (B) Average regional distribution volumes
(VT) and benzodiazepine receptor density for the GABAAR.
The regional VT's determined by PET were matched to the
corresponding regions from the [3H]diazepam autoradiography data.
The regression is shown as the black line, and the intercept is the
non-displaceable distribution volume (VND). The shaded area is the
95% confidence interval.
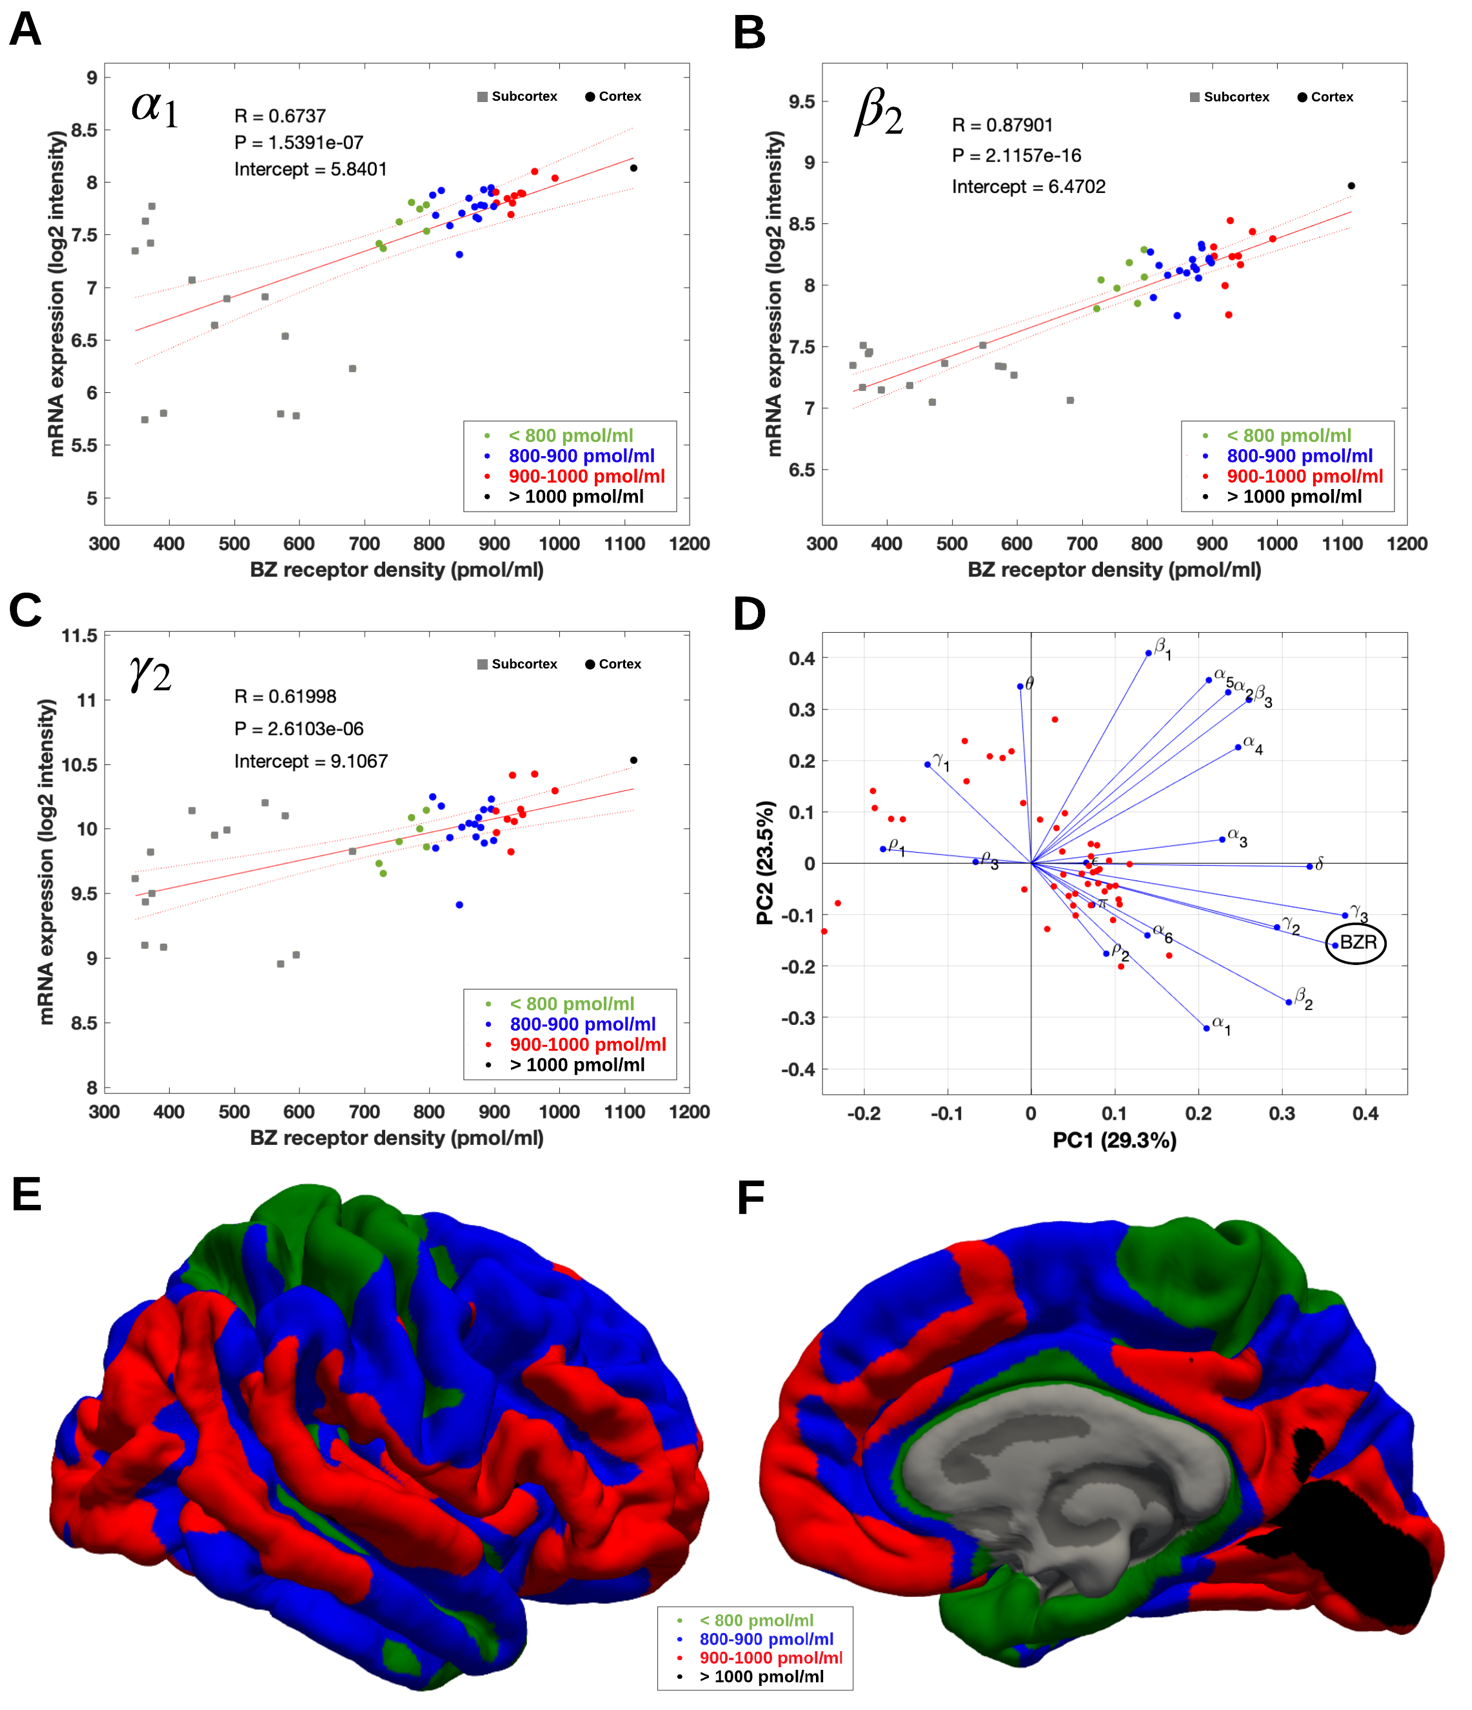
Figure 3: (A-C) Association between mRNA expression (log2 intensity) and BZR density for the subunits of the GABAAR most commonly represented in the BZR, a1 in (A), b2 in (B), and g2 in (C). The points are regional estimates for subcortex (squares) and cortex (round dots), and are color coded according to the density, green (<800 pmol/ml), blue (800-900 pmol/ml), red (900-1.000 pmol/ml), and black (>1.000 pmol/ml). (D) Biplot of the (scaled) first two principal components (% variance explained) of a PCA of the 19 subunits and BZR. (E-F) The spatial distribution of BZR density according to the specified color coding shown on the lateral and medial surface of the brain.
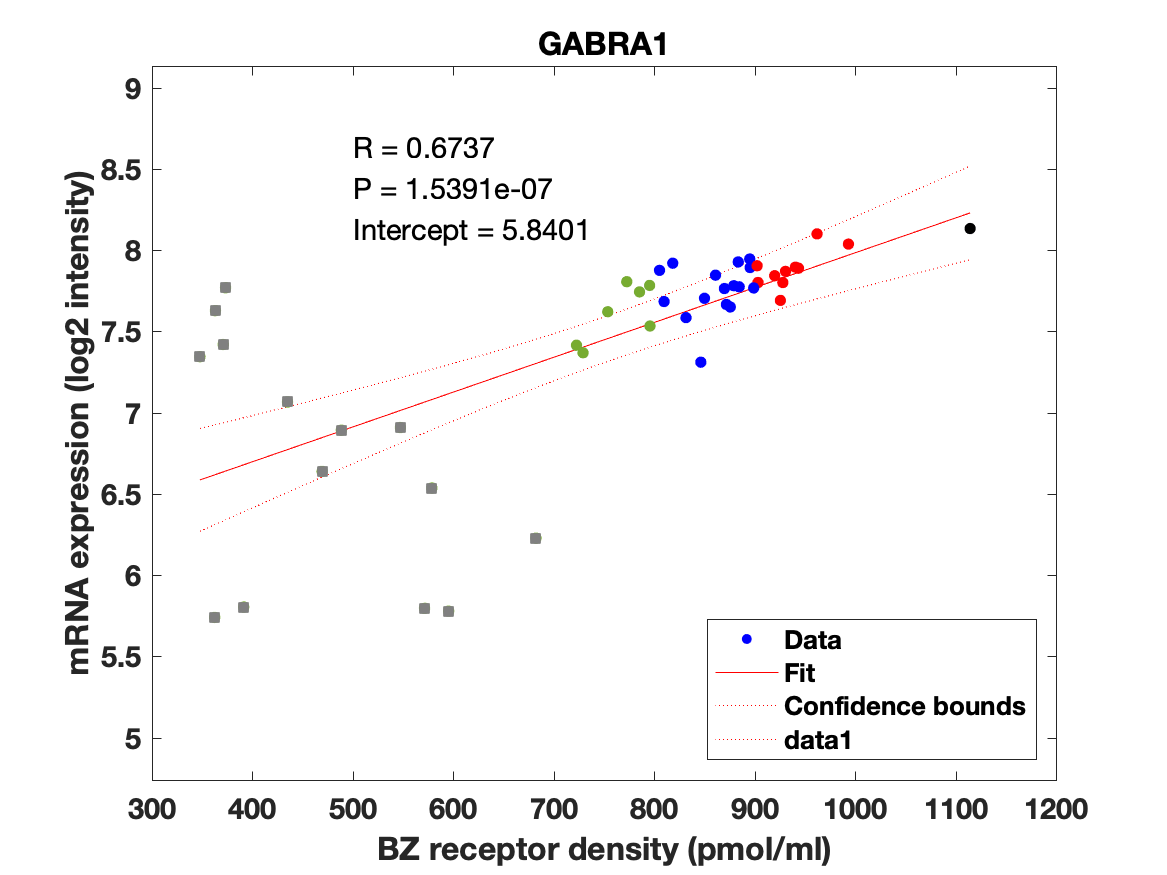

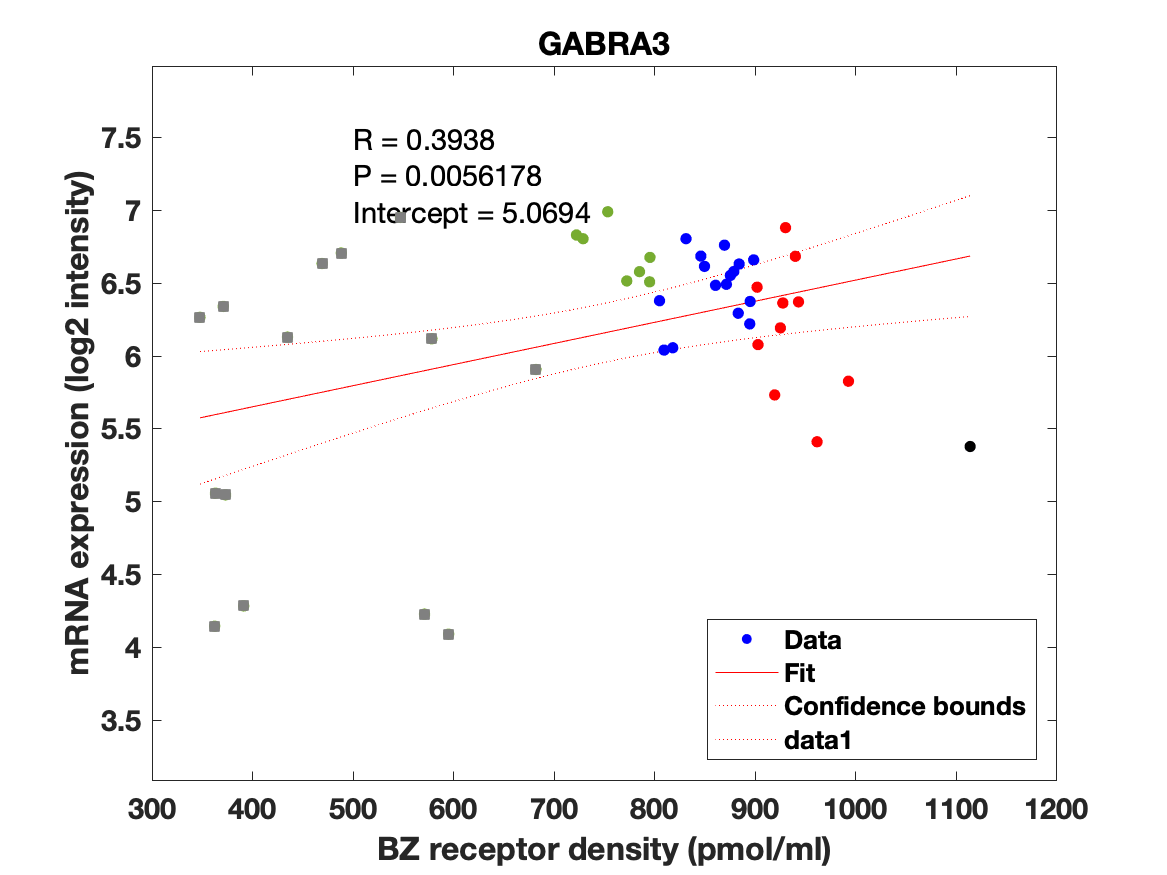


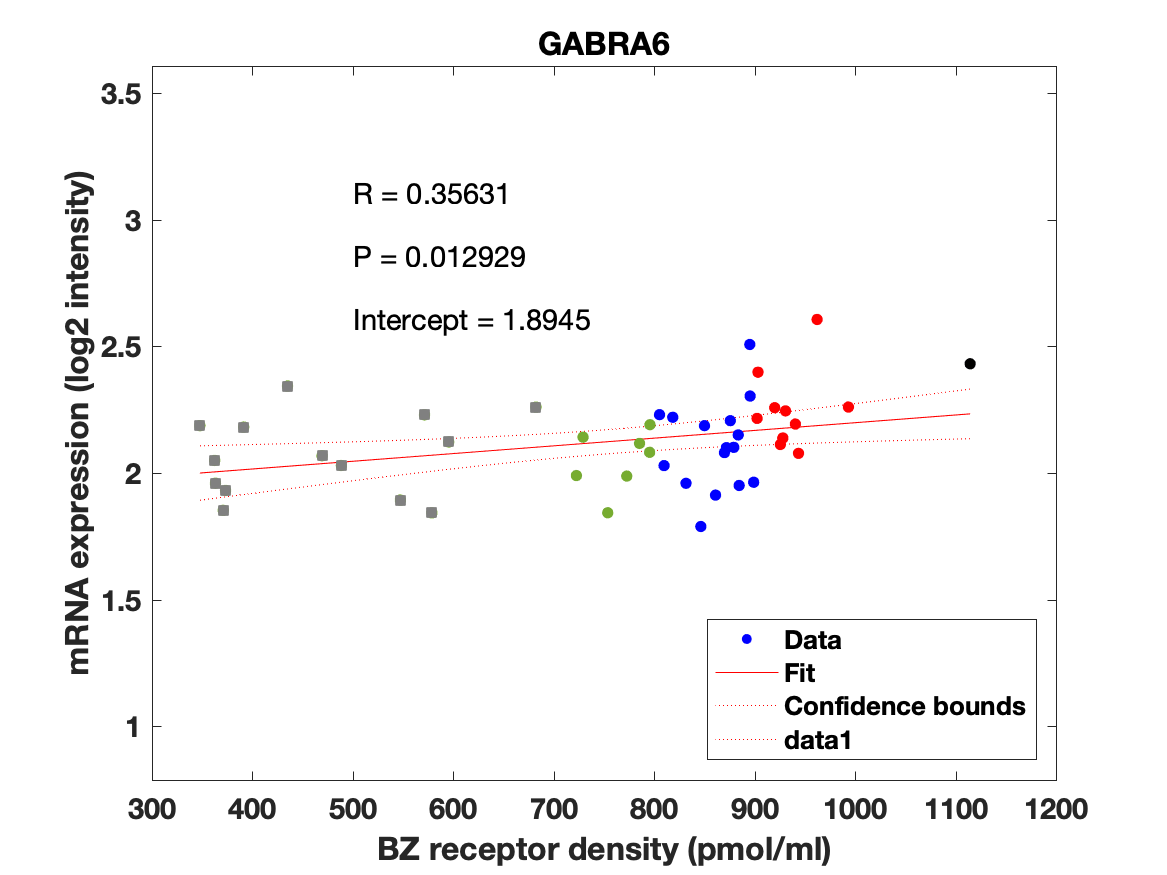
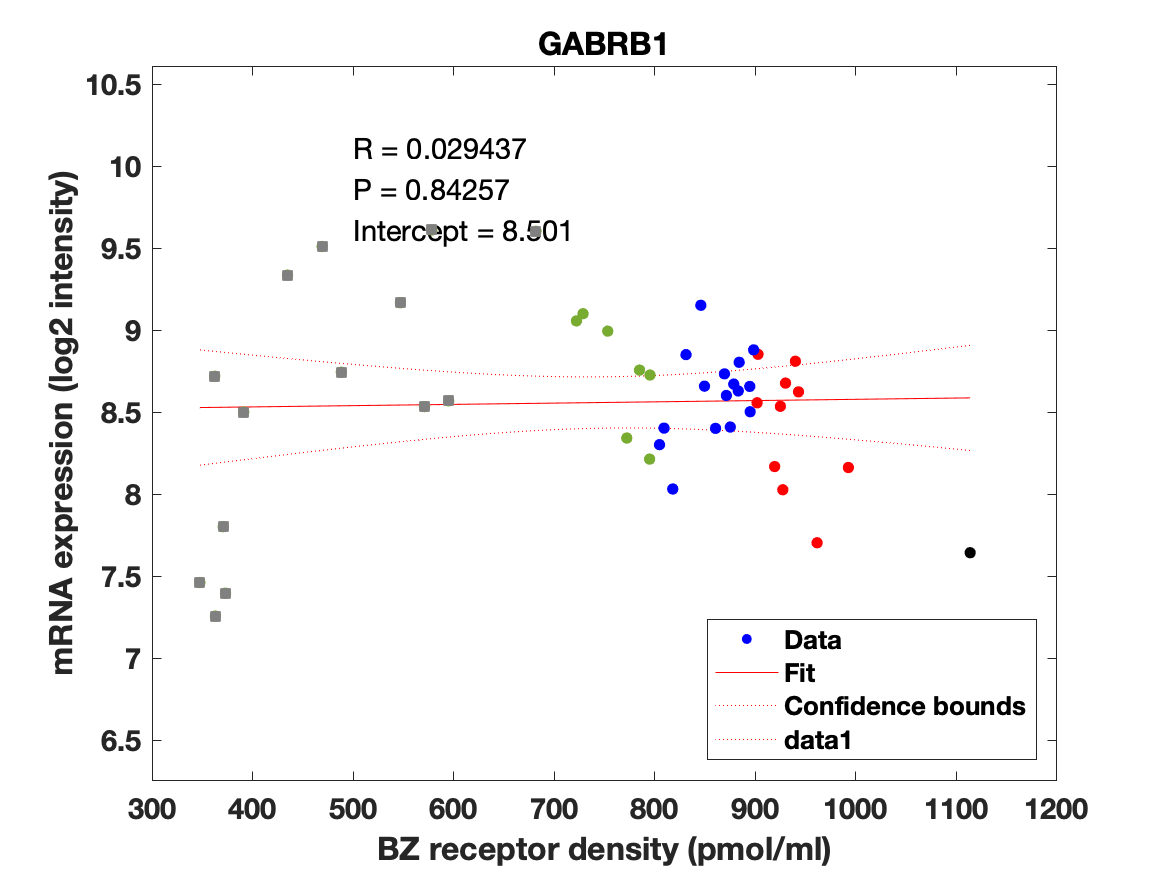
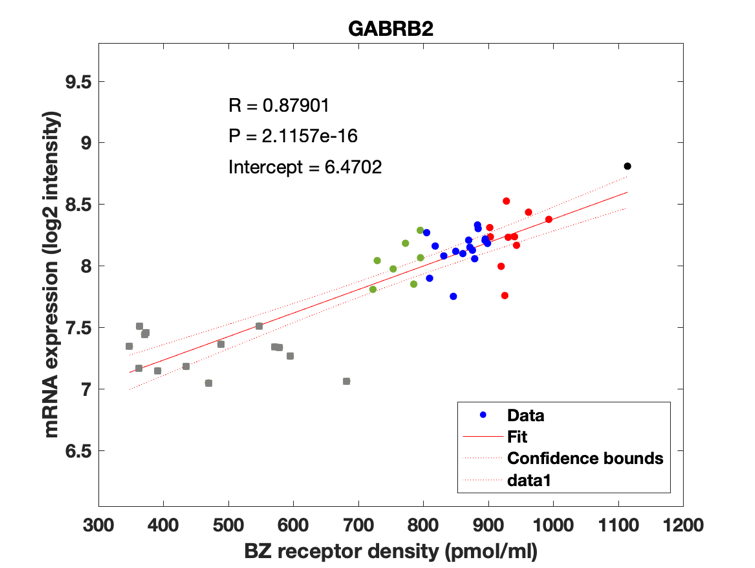
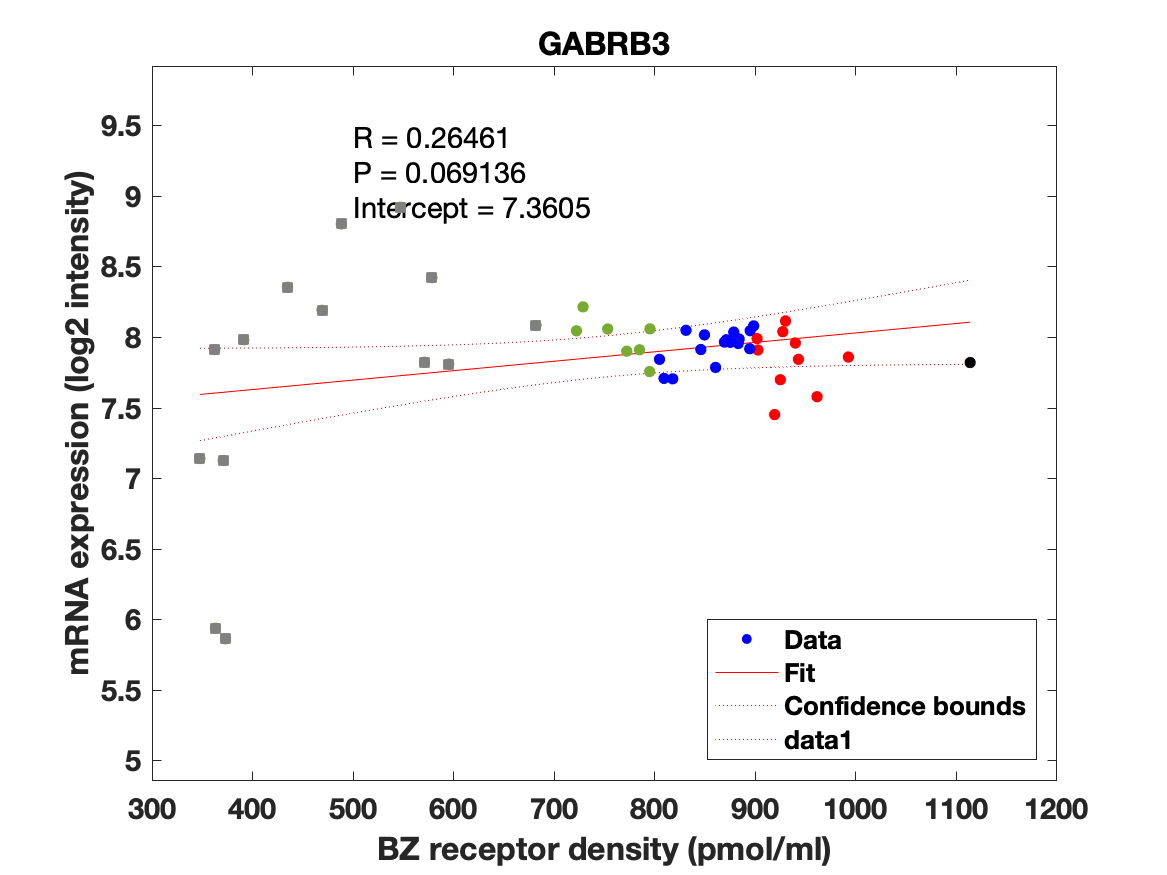
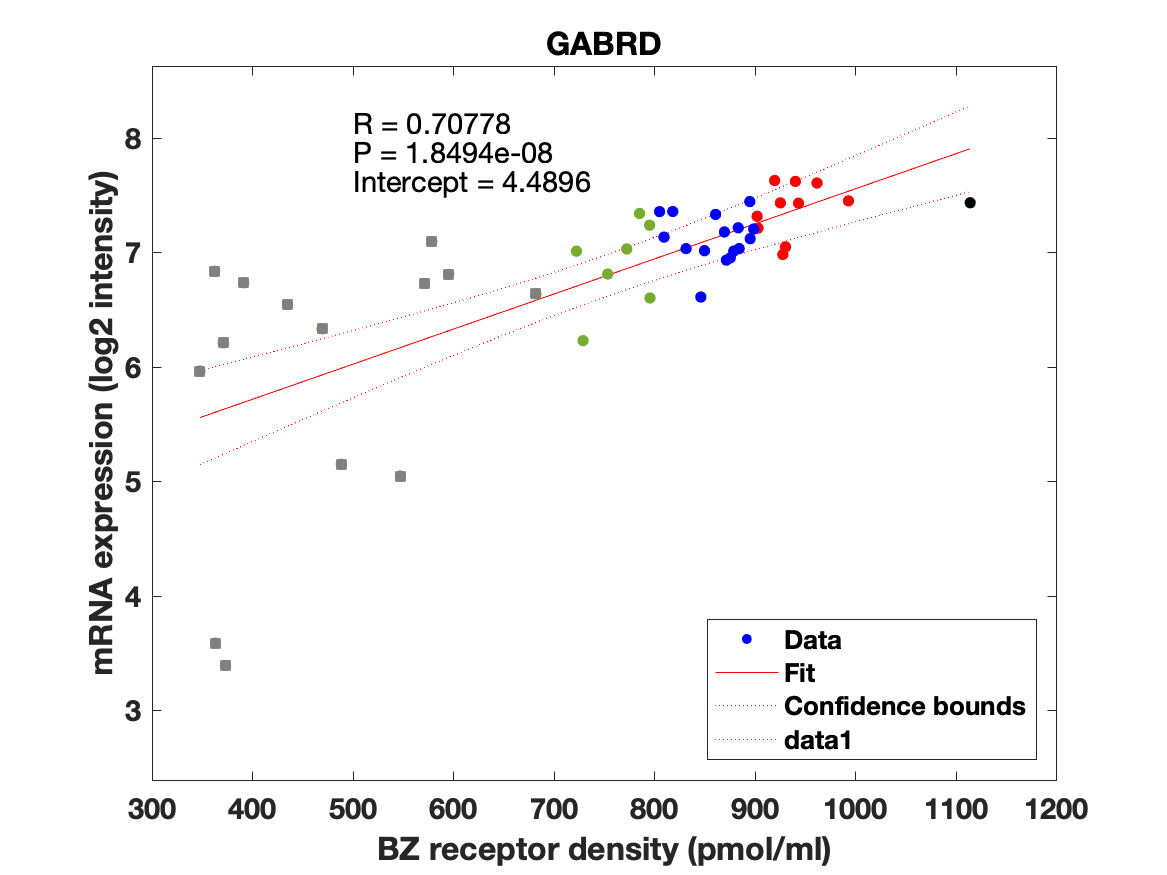
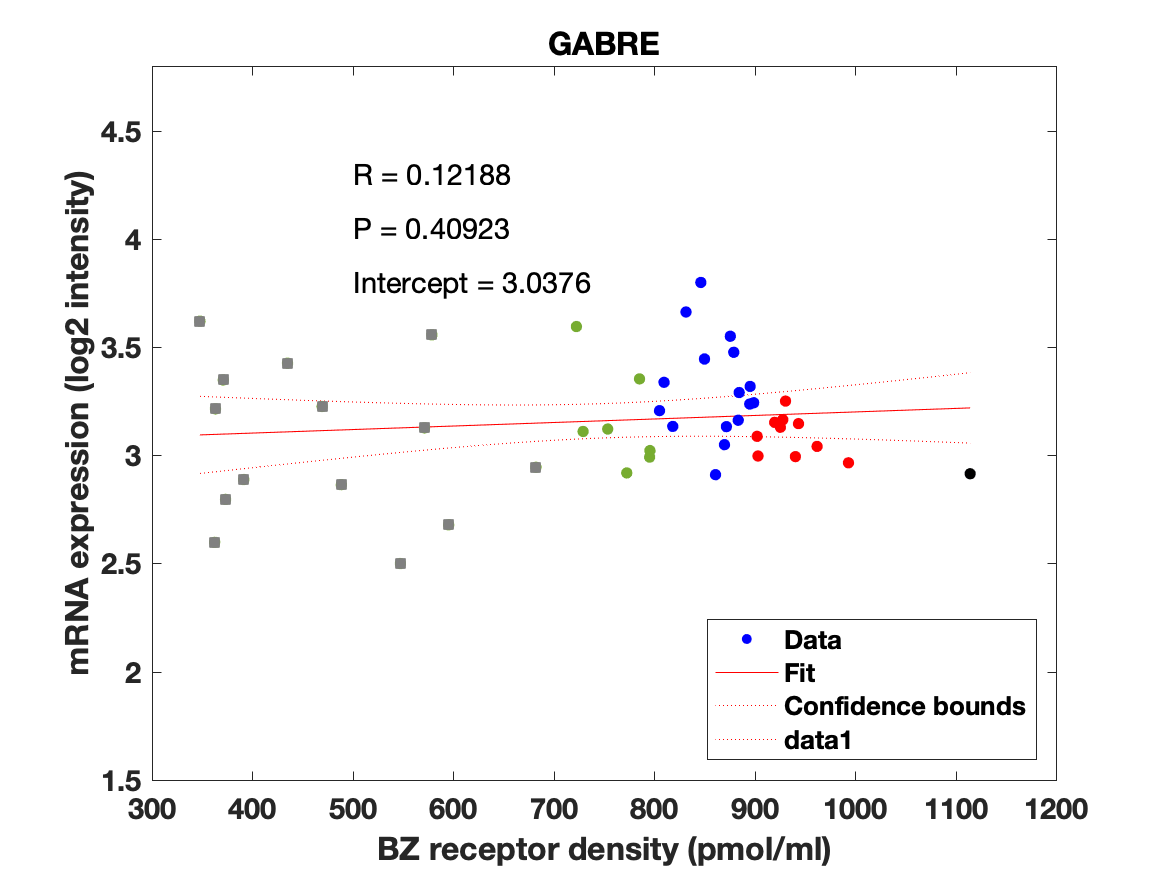
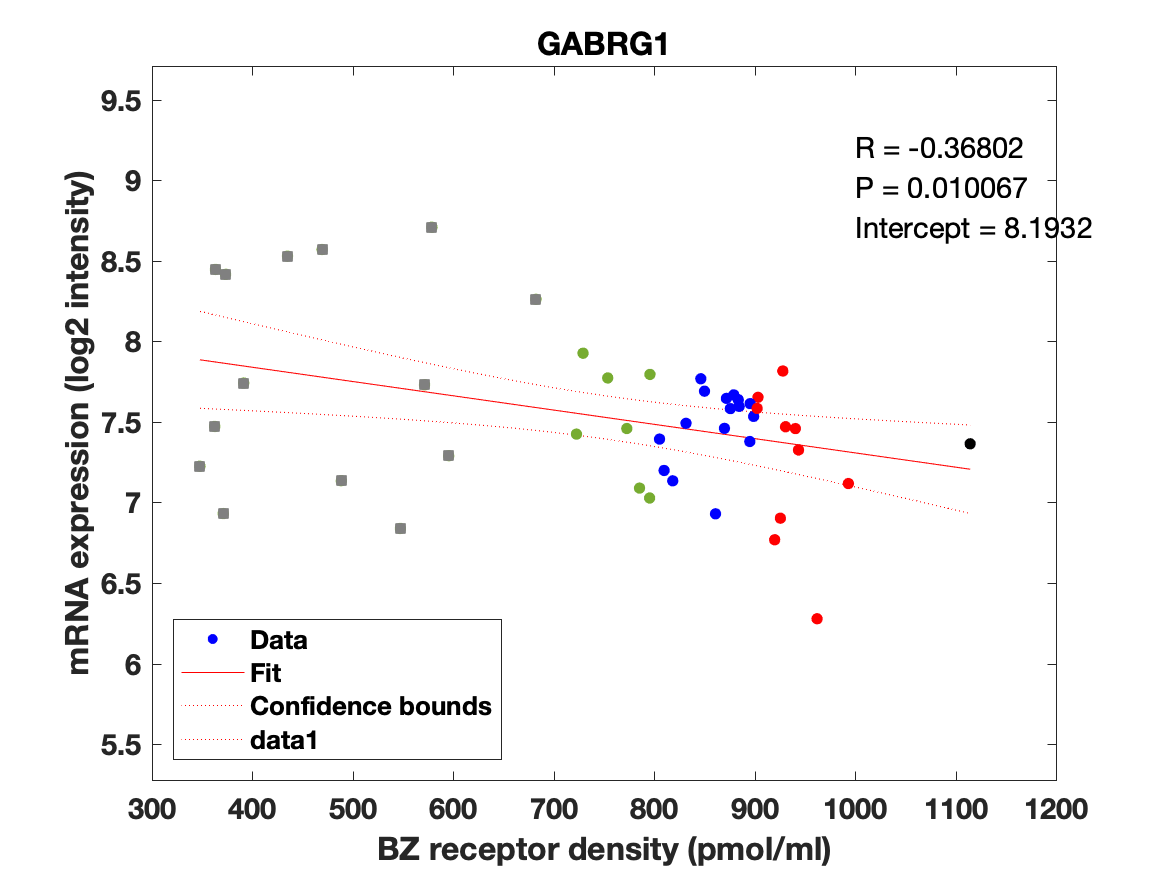
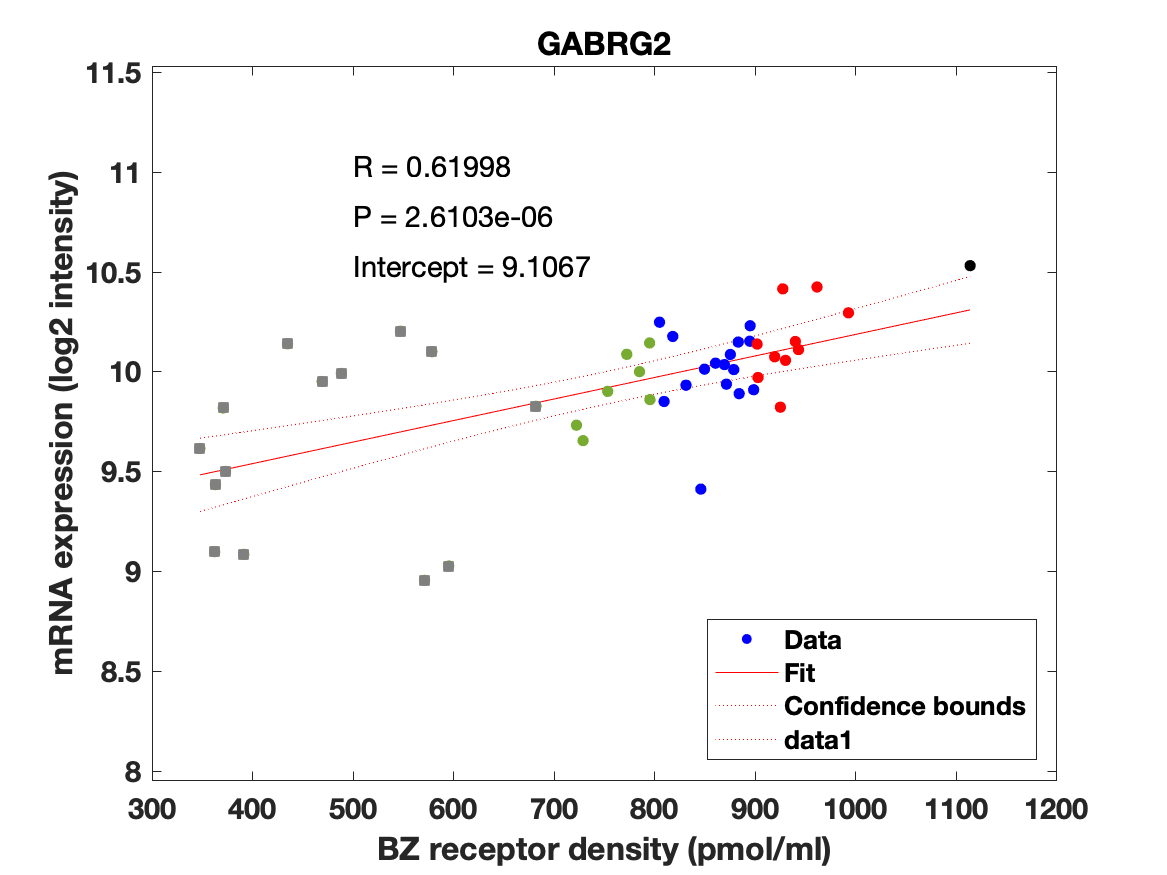
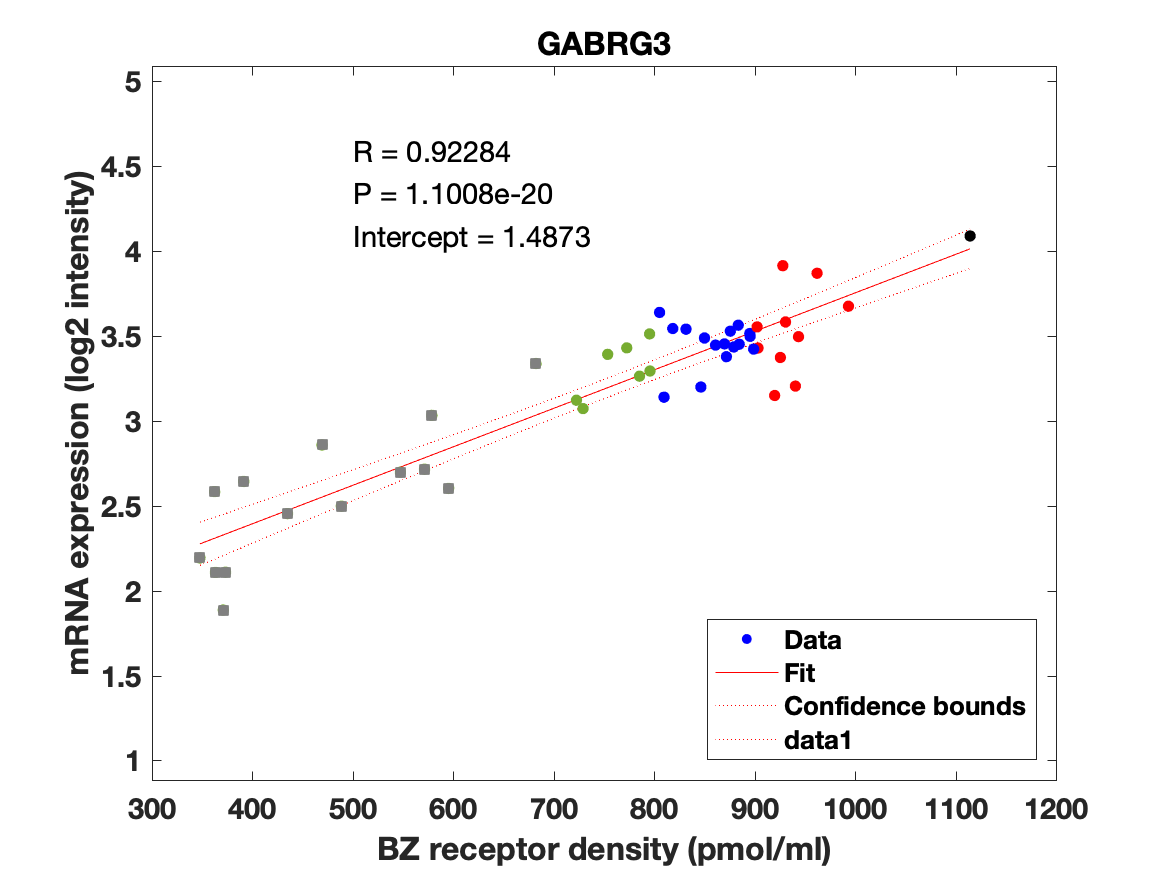
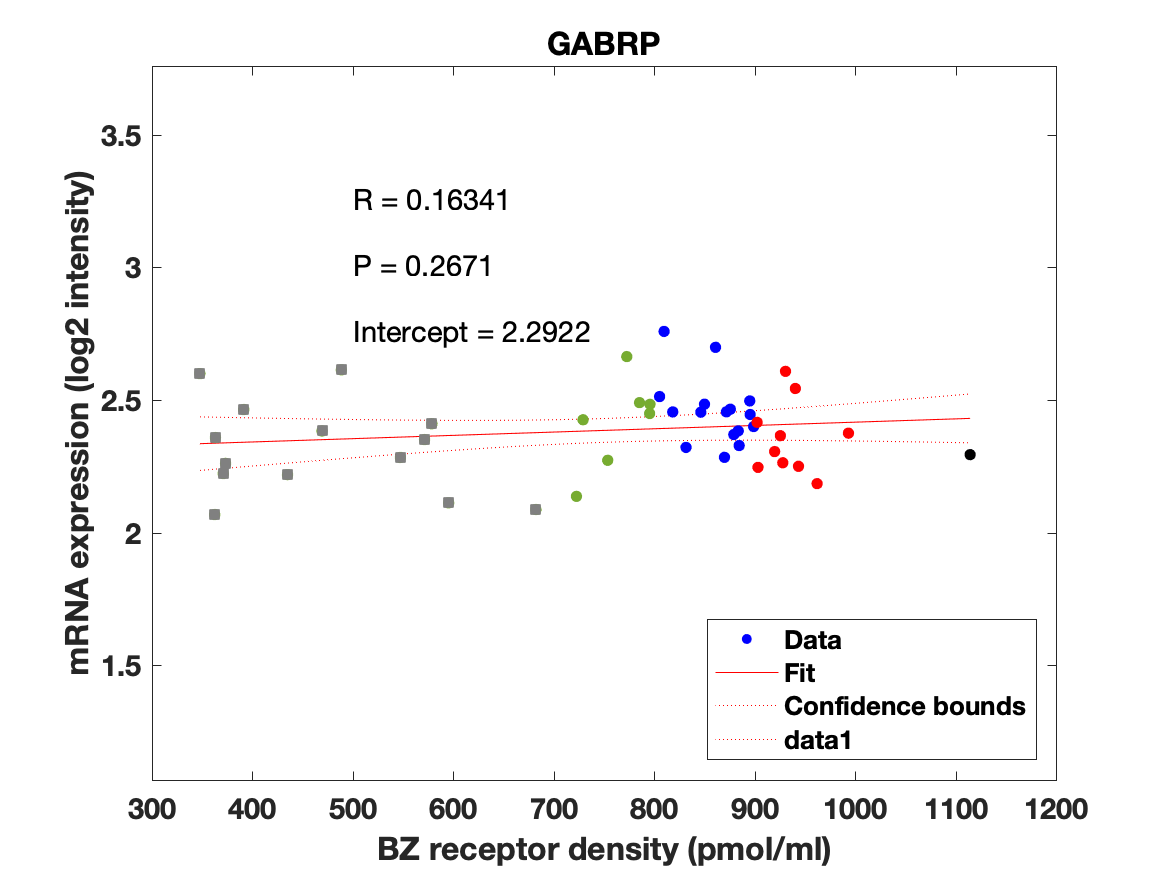


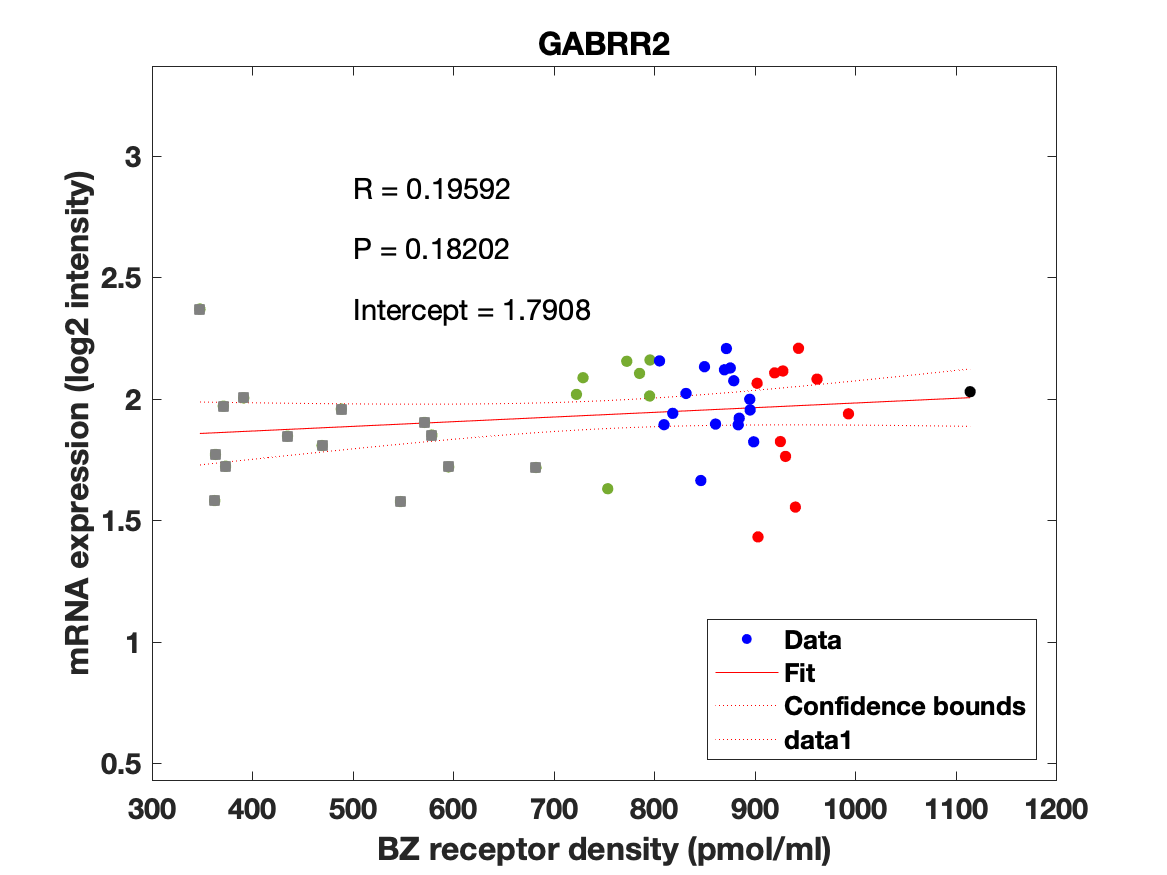
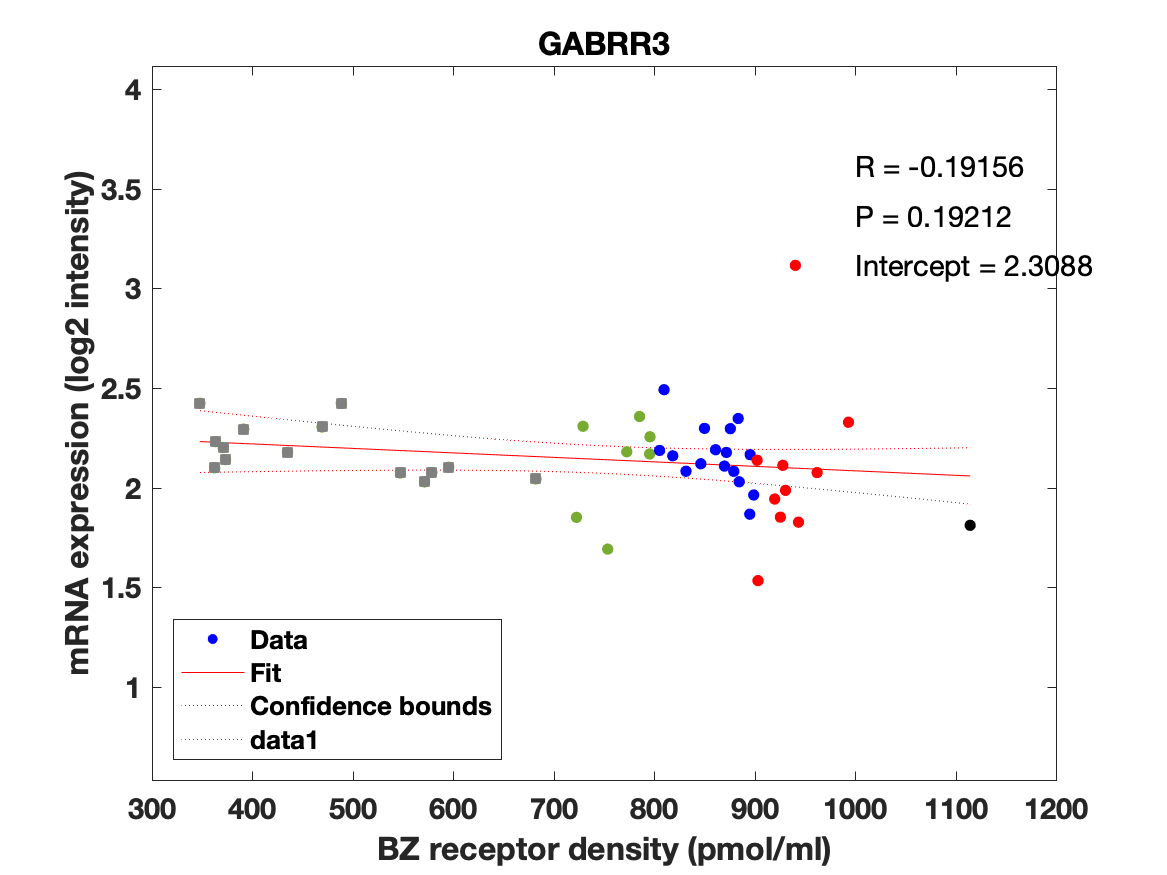
Figure 4: Association between mRNA expression (log2 intensity) and BZR density (pmol/ml) for the 19 subunits of the GABAAR.
Publications
The following publications should be referenced when using this atlas:
A High-Resolution In Vivo Atlas of the Human Brain's Benzodiazepine Binding Site of GABAA Receptors. Martin Norgaard, Vincent Beliveau, Melanie Ganz, Claus Svarer, Lars H Pinborg, Sune H Keller, Peter S Jensen, Douglas N. Greve, Gitte M. Knudsen. bioRxiv 2020.04.10.035352; doi: https://doi.org/10.1101/2020.04.10.035352
Downloads
All the atlas data, and the supplementary data can be found here (9.3 MB)
Bibliography
Braestrup, C., Albrechtsen, R., & Squires, R. (1977). High densities of benzodiazepine receptors in human cortical areas. Nature, 269(October), 702-704.
Comtat C, Sureau FC, Sibomana M, Hong IK, Sjoholm N, Trebossen R (2008) Image based resolution modeling for the HRRT OSEM reconstructions software. In: 2008 IEEE Nuclear Science Symposium Conference Record, pp 4120-4123. IEEE.
Feng, L., Svarer, C., Madsen, K., Ziebell, M., Dyssegaard, A., Ettrup, A., Pinborg, L. H. (2016). Design of Infusion Schemes for Neuroreceptor Imaging: Application to [11C]Flumazenil-PET Steady-State Study. BioMed Research International, 2016.
Hawrylycz,
M. J., Lein, E. S., Guillozet-Bongaarts, A. L., Shen, E. H., Ng, L., Miller, J.
A., Jones, A. R. (2012). An anatomically comprehensive atlas of the adult
human brain transcriptome. Nature, 489(7416), 391-399.
Knudsen GM et al. (2015) The Center for Integrated Molecular Brain Imaging
(Cimbi) Database. Neuroimage:1-7.
Olesen OV, Sibomana M, Keller SH, Andersen F, Jensen J, Holm S, Svarer C,
Hojgaard L (2009) Spatial resolution of the HRRT PET scanner using 3D-OSEM PSF
reconstruction. IEEE Nucl Sci Symp Conf Rec:3789-3790.
Sureau FC, Reader AJ, Comtat C, Leroy C, Ribeiro M-J, Buvat I, Trebossen R
(2008) Impact of image-space resolution modeling for studies with the
high-resolution research tomograph. J Nucl Med 49:1000-1008.
Woods RP, Cherry SR, Mazziotta JC (1992) Rapid automated algorithm for aligning
and reslicing PET images. J
Comput Assist Tomogr 16:620-633.
Contacts
For questions related to the NRU BZR atlas, contact Martin Norgaard (martin.noergaard(a)nru.dk) or Gitte M. Knudsen (gmk(a)nru.dk).
Copyright
Copyright (c) 2016, Neurobiology Research Unit, Rigshospital. All rights reserved according to CC 4.0 BY-NC-SA (https://creativecommons.org/licenses/by-nc-sa/4.0). Redistribution and use in source forms, with or without modification, are permitted provided that the following conditions are met: * You must give appropriate credit, provide a link to the license, and indicate if changes were made. You may do so in any reasonable manner, but not in any way that suggests the licensor endorses you or your use. * You may not use the material for commercial purposes. Neither the name of the Neurobiology Research Unit, Rigshospital nor the names of its contributors may be used to endorse or promote products derived from this image set without specific prior written permission. * If you remix, transform, or build upon the material, you must distribute your contributions under the same license as the original.